
How do I prevent ghost promoters in my mall activation campaigns in 2026?
2 min read

A practical 2026 audit-the-auditor playbook for retail chain CXOs, brand audit heads, internal control leads, procurement directors, and operations executives commissioning third-party retail audits across 100, 500, or 5,000+ stores. Built around the 7 verification questions, 8 auditor fraud patterns, and the AI verification stack replacing trust-based audit closeouts.
3 min
Time some auditors claim to complete an 80-point store audit. The realistic time is 25-45 minutes per store. When the same auditor closes 12 stores in 8 hours of work, every alarm bell should ring. The problem with traditional retail audit verification is not that fraud is undetectable. It is that brands stop looking. Audit completion gets confused with audit authenticity.
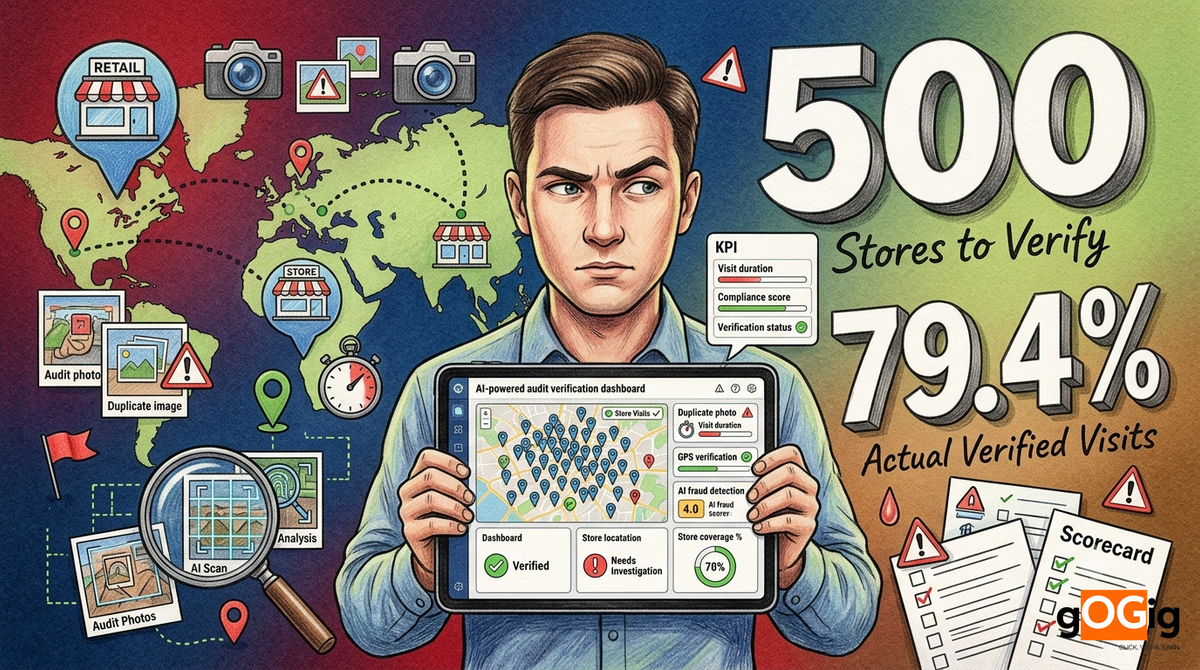
A national consumer-electronics retail chain commissions a 500-store retail audit across South India. 25 auditors. 80-point compliance checklist. 10 photos per store. ₹8.4 L invoice. Three weeks later, the closeout dashboard shows 100% coverage. The brand's audit head decides to run a verification sweep on the submitted data. SHA-256 hash analysis on the 5,000 photos reveals 312 cross-store duplicates. 84 audits were closed in under 6 minutes. 41 audits show identical compliance scores from auditors on different days. 27 audits were logged at coordinates more than 100 meters from the registered store address. The total verified visit count is 397 out of 500. The agency's 100% becomes the brand's 79.4%. The invoice was already paid. The brand absorbs ₹1.7 L of unverifiable expenditure and rewrites the FY27 procurement contract.
| Campaign attribute | 500-store reality |
|---|---|
| Total stores | 500 |
| Auditors deployed | 15-30 |
| Stores per auditor | 17-33 |
| Audit questions per store | 40-120 |
| Total audit questions | 20,000-60,000 |
| Photos per store | 5-15 |
| Total photos submitted | 2,500-7,500 |
| Cities / territories covered | 8-22 |
| Avg distance between stores | 4-18 km |
| Realistic audit time per store | 25-45 min |
| Travel time between stores | 20-40 min |
| Realistic daily output per auditor | 5-9 stores |
| Audit campaign duration | 2-4 weeks |
| Manual photo review at 12 sec each | 10-25 hours |
| Practical sample audit by brand HQ | 3-8% of stores |
Ghost store visit
Audit form completed; auditor never physically visited the store. Pure desk fraud. Detected by geofence + photo authentication.
5-12%
of audits
Drive-by audit
Auditor reaches store, takes a quick photo at the door, never enters or completes proper observation. 80-point checklist filled from memory.
8-16%
of audits
Speed-running fraud
Auditor closes 12-16 stores in a single 8-hour day. Statistically impossible to do a quality 80-point audit at this pace.
14-24%
of audits
Photo recycling
Same photo submitted as evidence for 2-4 different stores. SHA-256 hash detects identical files; perceptual hash detects near-duplicates.
6-14%
of audits
Score copy-paste
Identical compliance scores across multiple stores from same auditor. Real stores show variance; perfect uniformity = fabrication.
10-22%
of audits
Buddy auditor fraud
Assigned auditor sends a junior or family member to do the audit. Different face from registered ID. Face-match detects.
3-8%
of audits
Collusion with store
Auditor visits but accepts coffee + chai + cash to inflate compliance scores. Real audit becomes fake audit. Hardest pattern to detect from data alone.
4-9%
of audits
Backdate submission
Audits submitted in end-of-week batches; server-side timestamp differs significantly from claimed visit time. Operational integrity gap.
12-26%
of audits
| Question | Standard reporting | Verified proof (gOGig) |
|---|---|---|
| Did the auditor physically reach the store? | GPS pin (spoofable) | 9-layer mock-location detection + geofenced check-in |
| How long did the auditor stay? | Self-reported duration | Server-side check-in to check-out duration |
| Was the audit conducted properly? | Completed form | Audit-tempo analysis + photo timestamp distribution |
| Is the photo evidence authentic? | "It looks correct" | SHA-256 + perceptual hash + edit-signature detection |
| Did the same auditor actually conduct it? | Auditor name entered | Face-match + Aadhaar-validated ID at check-in |
| Are the auditor's daily routes feasible? | Trust-based | Route reconstruction + travel-time feasibility |
| Are the audit scores realistic across the network? | Aggregate report | Cross-auditor pattern detection + anomaly flags |
Geofenced store check-in (audit cannot start outside the geofence)
If the auditor is not physically at the store, the audit cannot begin. This is the simplest, most powerful verification gate.
| Geofence verification element | Value |
|---|---|
| Geofence radius | 30-50 meters around store |
| GPS authenticity | 9-layer mock-location detection |
| Triangulation cross-check | GPS + cellular tower + WiFi signature |
| Auditor identity | Face-match against registered Aadhaar photo |
| Audit form unlock | Only after geofence + identity confirmed |
| Backroom / multi-floor handling | Indoor GPS degraded; relies on entry check-in |
| Re-entry detection | If auditor leaves geofence mid-audit, flagged |
Live-capture photo verification (no gallery uploads)
Photos must be captured at the moment of audit, not pulled from gallery. Live capture closes the most common fraud channel.
| Photo capture rule | Implementation |
|---|---|
| Gallery uploads | Disabled at app level |
| Camera API forced | Mandatory; photo captured live |
| EXIF + GPS metadata preserved | Stripped EXIF = invalid submission |
| Server-side timestamp | Independent of device clock |
| SHA-256 hash | Generated at submission |
| Perceptual hash | Generated for near-duplicate detection |
| Cross-store duplicate check | Same photo across stores = fraud |
| Cross-campaign duplicate check | Same photo from prior audit = fraud |
| Edit-signature detection | Photoshopped or AI-altered = fraud |
Visit duration tracking (an 80-point audit cannot be done in 3 minutes)
Real audits take time. Duration anomalies are one of the strongest fraud signals.
| Audit complexity | Realistic duration | Fraud threshold |
|---|---|---|
| Quick spot check (20 questions) | 8-15 min | <5 min flagged |
| Standard audit (40 questions) | 15-25 min | <10 min flagged |
| Detailed audit (80 questions) | 25-45 min | <15 min flagged |
| Comprehensive audit (120 questions) | 35-60 min | <20 min flagged |
| Mystery shopper visit | 15-40 min | <10 min flagged |
| Daily output per auditor (8-hr day) | 5-9 stores | >10 stores flagged |
Route intelligence (auditor cannot be in 12 cities in one day)
Travel-time feasibility between stores creates an objective verification layer. Impossible routes auto-flag.
| Route verification element | What it detects |
|---|---|
| Continuous GPS trail across the day | Reconstructs actual movement |
| Per-store check-in + check-out timestamps | Defines visit windows |
| Inter-store travel time vs Google Maps benchmark | Catches impossible movement |
| Cross-city audits in single day | Flag if travel time inconsistent |
| Auditor's home base vs store cluster | Operational feasibility |
| Sequence anomalies | Same store visited 3 times by different auditors same day |
| Movement gaps | 2-3 hour gaps without check-in suggest audit fabrication |
Store-level evidence mapping (per-store audit record)
Move from "500 audits completed" to "500 individual store records, each with verifiable evidence chain".
| Per-store audit record | Field |
|---|---|
| Store ID | Pre-mapped from chain master |
| Store GPS coordinates | Pre-locked |
| Auditor ID | Assigned + face-matched |
| Check-in timestamp | Server-side |
| Check-out timestamp | Server-side |
| Audit duration | Calculated |
| Audit score (per category) | From form |
| Photo evidence (5-15 photos) | Live-captured, hashed |
| Mock-location flag | 0 or 1 |
| Photo duplicate flag | 0 or 1 |
| Route feasibility flag | 0 or 1 |
| Visit duration flag | 0 or 1 |
| Cross-auditor pattern flag | 0 or 1 |
| Final verified status | VERIFIED / FLAGGED / DISPUTED / MISSING |
AI detection of suspicious audit patterns across the network
The biggest fraud signal is often not one fake store. It is a pattern across hundreds of stores from the same auditor.
| Pattern | Manual detection | AI detection (gOGig) |
|---|---|---|
| Auditor closes >10 stores per day repeatedly | ~12% | 100% (route reconstruction) |
| Identical compliance scores across stores | ~6% | 100% (statistical anomaly) |
| Audit duration <15 min consistently | ~10% | 100% (server-side duration) |
| Photo duplicates across stores | 4-8% | 100% (SHA-256 + perceptual hash) |
| Cross-campaign photo re-use | ~0% | 100% (cross-database hash) |
| Same face on different auditor IDs | ~0% | 100% (face-match CNN) |
| Backdate submission gap | Rarely tracked | 100% (server vs claimed timestamp) |
| Identical answer patterns to subjective questions | ~0% | 100% (response-text similarity) |
| Impossible store visits in single day | ~5% | 100% (travel-time benchmark) |
| Photos with stripped EXIF metadata | ~3% | 100% (metadata integrity) |
Real-time store coverage dashboard (not Friday's PPT)
Brand HQ should see per-store coverage in real time, not wait for the Friday closeout.
| Live dashboard metric | Value |
|---|---|
| Campaign | Q4_RETAIL_AUDIT_BLR_HYD |
| Planned stores | 500 |
| Auditors deployed | 25 |
| Stores reported visited | 472 |
| Stores AI-verified | 441 |
| Stores flagged for review | 31 |
| Stores pending | 28 |
| Coverage % (reported) | 94.4% |
| Verified Visit Rate (VVR) | 88.2% |
| Auditors with >2 flags | 4 |
| Photo duplicates flagged | 84 photos / 27 stores |
| Audit duration anomalies | 18 stores |
| Mock-location flags | 7 auditors |
| Per-auditor Tier A+ count | 15 of 25 |
| Per-auditor Tier C-D count | 3 of 25 (intervention) |
Audit the auditor before approving any invoice
Free 30-Day Verification Challenge on one live retail audit campaign. Geofenced auditor check-in, live photo capture, audit-duration tracking, route feasibility, AI cross-store pattern detection, per-auditor scorecards, real-time dashboard. Field force continues using existing audit app. 100% verification accuracy. 100% fraud detection rate.
Request a 500-store audit verification pilot →What brands typically verify
Audit form submitted via agency app. Score calculated. PPT generated. Coverage % reported. Invoice raised. Payment approved on the assumption that submission = visit. No layer of independent authenticity check between submission and payment. The audit is complete in the system; whether it is genuine is never tested.
What brands should verify in 2026
Every audit checked for: physical presence (geofence + GPS authenticity), photo authenticity (SHA-256 + perceptual hash + edit-signature), audit duration (server-side timestamps), route feasibility (Google Maps benchmark), auditor identity (face-match + Aadhaar), cross-store pattern (statistical anomaly). Authenticity sits underneath completion as the gating layer.
| Per-auditor KPI | Tier A+ auditor | Tier C-D auditor |
|---|---|---|
| Verified Visit Rate (VVR) | 96-100% | 62-78% |
| Avg audit duration | 30-45 min | 8-18 min |
| Daily stores covered | 5-8 | 10-16 |
| Photo authenticity rate | 100% | 72-88% |
| Mock-location flag rate | 0% | 4-12% |
| Cross-store duplicate flag rate | <1% | 6-14% |
| Compliance score variance | Normal distribution | Suspiciously uniform |
| Route feasibility | 100% feasible | 14-22% infeasible |
| Backdate submission rate | <2% | 22-44% |
| Re-audit confirmation rate | >92% | 62-78% |
| Contract renewal probability | ~94% | ~28% |
| India retail audit indicator | Value |
|---|---|
| India mystery shopping market | ~$150M |
| Major mystery audit firms (national) | ~25-40 firms |
| Auditor / shopper databases (top firms) | 50,000-100,000+ per firm |
| Monthly audits conducted (top firms) | 3,000-6,000+ per firm |
| Cities and towns covered | 200+ |
| Sectors served | Retail, QSR, BFSI, automotive, telecom, hospitality, healthcare, real estate, education |
| Avg audit cost per store | ₹800-2,500 |
| 500-store campaign typical invoice | ₹4-12 L |
| Avg leakage (unverified audit campaigns) | 12-22% |
| Regulatory mystery audit mandates | RBI BFSI, IRDAI insurance, FSSAI food retail |
| BRSR Core impact | Top 250 → top 1,000 by FY 2026-27 |
| Audit campaign scale | Verification cost (gOGig) | Avg leakage prevented | Net ROI |
|---|---|---|---|
| 100 stores | ₹15,000-30,000 | ₹80,000-1.8 L | 4-9x |
| 250 stores | ₹35,000-65,000 | ₹2-4.5 L | 5-11x |
| 500 stores | ₹65,000-1.2 L | ₹4-9 L | 5-13x |
| 1,000 stores | ₹1.2-2.2 L | ₹8-18 L | 5-15x |
| 2,500 stores | ₹2.8-5.2 L | ₹20-45 L | 6-16x |
| 5,000+ stores | ₹5-10 L | ₹40-90 L | 6-18x |
| Red flag | What it suggests |
|---|---|
| Audit completion 100% across all auditors every week | Statistical impossibility |
| Average audit duration <15 min for an 80-point audit | Speed-running fraud |
| Photos consistently shot from the same angle | Studio-shot or recycled |
| EXIF/GPS metadata absent on all submissions | WhatsApp-standard or manually scrubbed |
| Same auditor visits 14+ stores per day repeatedly | Above realistic daily output |
| Compliance scores cluster tightly (variance <8 pp) | Score fabrication |
| Audits submitted in Friday-night batches | Backdate submission |
| Agency refuses face-match identity verification | Substitute auditor risk |
| Agency objects to per-auditor scorecard sharing | Avoiding accountability transparency |
| Invoice arrives before agreed campaign closeout date | Pre-prepared invoice; not data-driven |
| Dimension | Manual review | gOGig pipeline |
|---|---|---|
| Coverage of audits verified | 3-8% sampling | 100% |
| Ghost store visit detection | ~12% | 100% (geofence + mock-location) |
| Drive-by audit detection | ~6% | 100% (duration + indoor GPS analysis) |
| Speed-running detection | ~10% | 100% (duration + route analysis) |
| Photo recycling detection | 4-8% | 100% (SHA-256 + perceptual hash) |
| Score copy-paste detection | ~0% | 100% (statistical anomaly) |
| Buddy auditor detection | ~0% | 100% (face-match CNN) |
| Backdate submission detection | ~0% | 100% (server vs claimed timestamp) |
| Time per audit verified | 15-25 min | ~3 seconds |
| Audit-grade retention | Manual collation | 7-year structured retention |
| Per-auditor scorecard refresh | Monthly | Real-time |
| Year-1 ROI | Baseline | 5-18x |
The real question is not "did the agency submit 500 audits?". The real question is "can every one of those 500 store visits be independently verified as having actually happened, in person, by the registered auditor, for a duration consistent with a real 80-point audit?". An audit is not authenticated by its completion in software. It is authenticated by the chain of evidence underneath it.
Geofenced auditor check-in for every store, with 9-layer mock-location detection
Live-capture photo verification (gallery uploads disabled)
Auditor face-match + Aadhaar-validated ID at every store check-in
Visit duration tracking with server-side check-in / check-out timestamps
SHA-256 + perceptual hash + edit-signature detection on every photo
Cross-store + cross-campaign duplicate detection
Route feasibility validation with Google Maps benchmark
Audit-tempo analysis flagging unrealistic durations
Statistical anomaly detection on compliance score patterns
Per-store evidence record with all 14 data fields
Per-auditor Tier A+ to D scorecard refreshed real-time
Real-time coverage dashboard showing reported vs verified split
Verified Visit Rate (VVR) as a contractual KPI
Proof-before-payment workflow for invoice 3-way matching
5-10% random re-audit sampling by independent third party
7-year audit-grade retention + BRSR Core-ready evidence pack
Verified by gOGig certification or equivalent independent verification standard
gOGig's audit verification stack works across every sector commissioning third-party retail, compliance, and mystery audits.
gOGig's audit-the-auditor verification runs across India's metros, tier 1, and tier 2 cities where retail audit campaigns are commissioned.
Audit the auditor before approving any invoice
Free 30-Day Verification Challenge on one live retail audit campaign. Geofenced auditor check-in, live photo capture, audit-duration tracking, route feasibility, AI cross-store pattern detection, per-auditor scorecards, real-time dashboard. Field force continues using existing audit app. 100% verification accuracy. 100% fraud detection rate.
100%
AI accuracy
100%
Detection rate
5-18x
Year-1 ROI
Written by
gOGig Editorial Team
The gOGig Editorial team publishes research, frameworks, and field intelligence drawn from gOGig Labs' dataset of 10,000+ verified field submissions across FMCG, OOH, BTL, pharma, and BFSI sectors.
Was this article helpful?
Your feedback helps us write better content.

