
How do I prevent ghost promoters in my mall activation campaigns in 2026?
2 min read

A practical 2026 area-accountability playbook for FMCG, cement, paint, agri-input, and BFSI marketing operations heads running large-area wall painting campaigns. Built around the 7-step verification framework, area-inflation fraud detection, and the per-square-foot accounting discipline that turns 50,000 sq ft from a claim into a CFO-defensible deliverable.
8-14%
Average area inflation across unverified wall painting campaigns in India. On a 50,000 sq ft campaign, this means 4,000 to 7,000 sq ft is billed but never painted. The most common form of OOH leakage in India's wall painting category is not phantom walls or recycled photos. It is the centimeter-by-centimeter overstatement of wall dimensions, hidden inside hundreds of self-reported measurements.
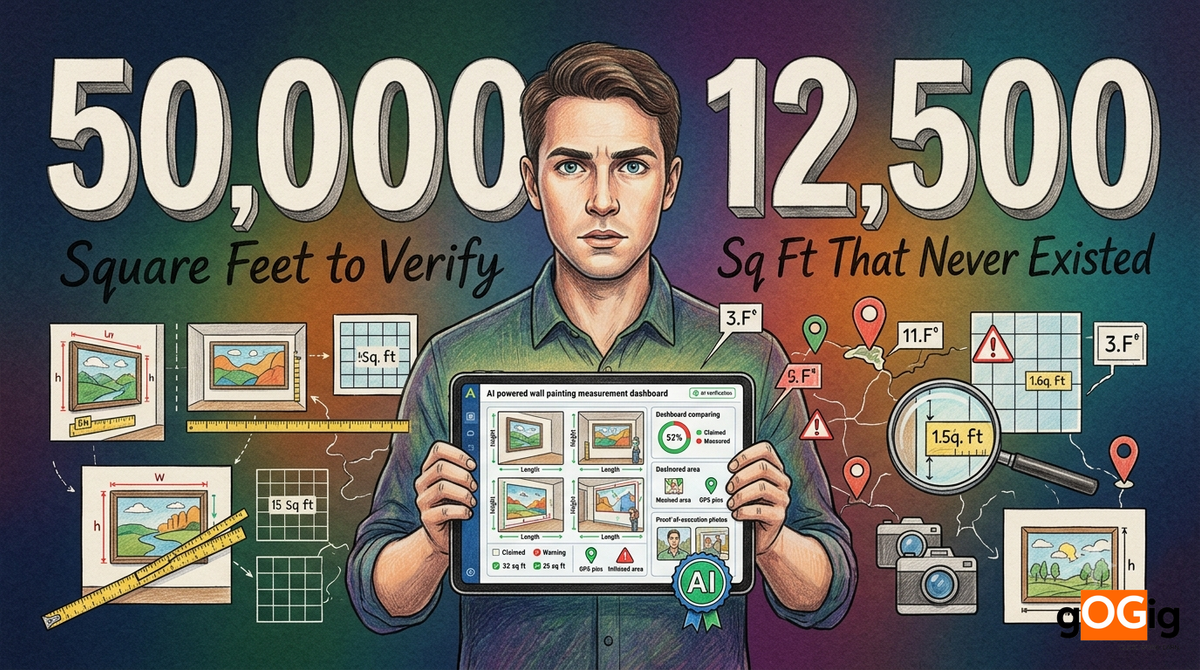
A national FMCG brand commissions a 50,000 sq ft wall painting campaign across 84 towns in Uttar Pradesh and Bihar at ₹10 per sq ft. ₹5 L invoice. 500 walls reported across 84 towns. Closeout PPT shows 100% completion. Three contractors. Brand's regional sales head approves invoice in week 8 of the campaign. Eight weeks later, an internal area audit on a 60-wall random sample reveals: average claimed wall size 110 sq ft; average measured wall size 88 sq ft. The implied area inflation is 25%. Translating across 500 walls: 12,500 sq ft of claimed painting never existed. ₹1.25 L of the invoice rests on dimensions that were never measured, only declared. The brand's procurement head adds a clause to the FY27 RFP: every wall area must be independently measured before invoice approval.
| Campaign attribute | 50,000 sq ft reality |
|---|---|
| Total walls | 300-700 (varies by wall size) |
| Total area | 50,000 sq ft (~4,645 sq m) |
| Average wall area | 80-150 sq ft |
| Photos submitted (3 per wall) | 900-2,100 |
| Geographic spread | 40-100+ towns or villages |
| Districts covered | 4-12 |
| States covered | 1-4 |
| Contractor teams | 2-8 |
| Painters deployed | 20-60 |
| Campaign duration | 3-8 weeks |
| Per sq ft cost (avg) | ₹8-12 |
| Total invoice value | ₹4-7.5 L |
| Manual review time at 30 sec/photo | 7.5-17.5 hours |
| Manual area-audit feasibility (5%) | Limited to 15-35 walls |
Area inflation worked example (50,000 sq ft campaign)
How vendor-claimed area diverges from independently measured area on a typical 500-wall campaign.
Planned campaign area
50,000 sq ft
Walls in scope
500
Per sq ft rate
₹10
Vendor-claimed avg wall area
110 sq ft
Total vendor claim
55,000 sq ft (500 × 110)
Independently measured avg wall area
88 sq ft
Verified delivered area
44,000 sq ft (500 × 88)
Apparent inflation
11,000 sq ft (20%)
Inflated billing value
₹1,10,000
Convert every wall into a trackable asset
Instead of "500 walls completed", the campaign becomes WP-001 to WP-500. Each wall is locked to a physical location.
| Per-wall asset field | Locked before painting begins |
|---|---|
| Unique wall ID (WP-NNN) | Mandatory |
| GPS coordinates | Pre-mapped during scouting |
| Town / village + PIN | Pre-locked |
| Wall dimensions (planned) | Width × height in feet |
| Wall type (brick / plaster / mud / concrete) | Pre-recorded |
| Visibility class | Highway / market / village square / lane |
| Owner consent reference | Form + OTP captured |
| Creative variant assigned | Language + design version |
| Contractor + painter ID | Pre-locked |
Measure area wall-by-wall, not as a campaign total
The biggest fraud is not fake photos. It is inflated dimensions hidden across hundreds of walls.
| Measurement method | Accuracy | Operational fit |
|---|---|---|
| Painter self-measurement (tape) | ±15-25% (biased upward) | Default; needs verification |
| Supervisor tape re-measurement | ±5-8% | Random 10-20% sample |
| AI photogrammetry from wall image | ±2-5% | Wall-level on every photo |
| Reference object scaling (printed marker, A4 sheet) | ±1-3% | Wall-level on every photo |
| Smartphone AR tape measure | ±2-5% | Painter-supervisor parity |
| LiDAR (high-end phones) | ±0.5-1.5% | Audit-grade for premium |
| Drone survey | ±1-2% | Large-area / urban audits |
Use GPS + geofenced capture
A photo alone proves almost nothing. Coordinates + timestamp + identity + live capture turn it into evidence.
| Verification layer | What it confirms |
|---|---|
| GPS coordinates (live) | Wall is at the assigned location |
| 9-layer mock-location detection | GPS authenticity (no spoofing apps) |
| Live-capture validation | Photo captured at moment, not from gallery |
| Server-side timestamp | When the painting actually happened |
| Painter face-match | Assigned painter, not substitute |
| Geofence (25-50m around wall) | Painter physically at wall, not nearby |
| EXIF metadata integrity | No editing or stripping |
Run AI duplicate detection across all 1,500+ photos
Manual review of 1,500 images takes 7-17 hours and still misses 80% of near-duplicates.
| Duplicate pattern | Manual detection | AI detection (gOGig) |
|---|---|---|
| Exact pixel match | 10-18% | 100% (SHA-256) |
| Cropped 5-25% | ~3-5% | 100% (perceptual hash) |
| Rotated | ~1-2% | 100% |
| Brightness / contrast shifted | ~2-4% | 100% |
| Mirror flipped | ~1% | 100% |
| Same wall, different angle | ~0% | 100% (CNN feature match) |
| Different lighting / time of day | ~0% | 100% |
| Cross-village re-use | ~0% | 100% |
| Cross-campaign re-use | ~0% | 100% |
Create a live coverage map (by area, not by photo count)
Instead of reviewing 1,500 images, the brand should see verified square footage in real time.
| Coverage metric | Live value |
|---|---|
| Planned area | 50,000 sq ft |
| Walls planned | 500 |
| Walls completed (reported) | 478 |
| Walls AI-verified (GPS + photo + measurement) | 462 |
| Walls flagged for review | 16 |
| Verified area | 46,850 sq ft |
| Inflation detected (vendor vs measured) | 11.4% |
| Pending area | 3,150 sq ft |
| Coverage % (walls) | 92.4% |
| Coverage % (verified area) | 93.7% |
| Verified Execution Rate (VER) | 92.4% |
Conduct random physical audits at 5-10% sample
Verify 100% digitally. Physically audit a random 5-10% of walls with tape measure.
| Physical audit attribute | 50,000 sq ft campaign protocol |
|---|---|
| Sample size | 25-50 walls (5-10%) |
| Sampling method | Random + stratified by contractor + by district |
| Tape re-measurement | Width × height, photographed |
| Comparison against vendor claim | Per-wall variance flagged |
| 30-day degradation check | Wall still visible / painted over |
| 90-day degradation check | Long-term durability sample |
| Cross-vendor audit comparison | Per-contractor accuracy index |
| Auditor independence | Third-party, not vendor-side |
Link payment to verified area, not reported area
Do not approve payment based on what the vendor reports. Approve payment based on what AI + audit verifies.
| Payment dimension | Pre-PBP | With PBP (verified area) |
|---|---|---|
| Invoice basis | Vendor-claimed area | AI + audit-verified area |
| Per sq ft rate applied to | 50,000 (claim) | 46,850 (verified) |
| Hold-back for flagged walls | None | Until resolution |
| Hold-back for inflation variance | None | % variance × hold-back |
| Payment cycle | 60-90 days | 14-28 days |
| Dispute resolution | 14-30 days | 2-5 days |
| Audit defensibility | Weak | Strong (CFO-grade) |
Get every square foot independently verified before invoice approval
Free 14-day Field Execution Intelligence pilot for FMCG, cement, paint, agri-input, and BFSI marketing operations. Per-wall asset IDs, AI photogrammetry for area measurement, 9-layer mock-location detection, AI duplicate detection, live coverage dashboard, 30/90-day degradation audit, proof-before-payment on verified area. 100% verification accuracy. 100% fraud detection rate.
Request a 50,000 sq ft verification pilot →Asset layer
Unique wall IDs (WP-001 to WP-500). GPS coordinates. Village / town mapping. Pre-locked area measurements. Owner consent forms with OTP.
Proof layer
Timestamped images. Geotagged evidence. Live-capture records. Painter face-match. AI photogrammetry per wall. SHA-256 + perceptual hash. Reference-object scaling.
Intelligence layer
Duplicate detection across all walls and prior campaigns. Coverage analytics (by walls + by area). Missing-wall alerts. Per-contractor compliance scoring. Area-inflation variance per vendor.
Finance layer
Verified square footage. Audit trail per wall. Exception reporting. Proof-before-payment approval. 3-way matching (PO + invoice + verified delivery). 7-year structured retention.
| Leakage scenario | Lost sq ft | Hidden invoice value (₹10/sq ft) |
|---|---|---|
| 5% area inflation | 2,500 sq ft | ₹25,000 |
| 8% area inflation | 4,000 sq ft | ₹40,000 |
| 11% area inflation | 5,500 sq ft | ₹55,000 |
| 14% area inflation | 7,000 sq ft | ₹70,000 |
| 18% area inflation | 9,000 sq ft | ₹90,000 |
| 22% area inflation | 11,000 sq ft | ₹1,10,000 |
| 28% area inflation | 14,000 sq ft | ₹1,40,000 |
| Red flag | What it suggests |
|---|---|
| Average wall size consistently >120 sq ft | Inflation bias; real distribution wider |
| Wall dimensions reported in round numbers (10×12, 12×15) | Painter estimating, not measuring |
| No reference objects in any wall photo | Cannot scale photo to measure independently |
| Vendor refuses tape re-measurement on audit walls | Avoids being caught |
| Photos cropped tightly around painted area | Hides unpainted regions of wall |
| Total area always matches campaign brief exactly | Reverse-engineered to fit invoice |
| Per-wall area variance <10% across hundreds of walls | Real walls vary widely; uniformity = fabrication |
| Vendor wants invoice approval before 30-day audit window | Walls may not survive 30 days |
| Painter face-match shows different painter mid-campaign | Substitute painter quality concerns |
| Wall dimensions only photographed without numerical entry | Cannot cross-verify against painter claim |
| Step | Process |
|---|---|
| 1. Painter captures wall photo | Live-capture with reference object (printed A4 marker, brick course, mobile phone) |
| 2. AI detects wall boundaries | Edge detection isolates the painted area from surroundings |
| 3. AI detects reference object | A4 sheet, brick course, or printed marker identified for scale |
| 4. AI computes pixels-per-foot ratio | Reference object's known size yields scale factor |
| 5. Wall dimensions computed | Width and height in feet calculated from edges |
| 6. Area calculated (W × H) | Result in sq ft, accurate to ±2-5% |
| 7. Cross-check against painter claim | Variance flagged if >10% |
| 8. Confidence score generated | Score below threshold triggers human review |
| 9. Per-wall verified area locked | Stored in JOB record; used for invoice math |
| 10. Cross-vendor accuracy index | Per-contractor inflation pattern tracked |
| Dimension | Manual review | gOGig AI pipeline |
|---|---|---|
| Coverage of submissions audited | 4-12% sampling | 100% |
| Per-wall area accuracy | ±15-25% (painter self-claim) | ±2-5% (AI photogrammetry) |
| Time to verify 1,500 photos | 7.5-17.5 hours | ~3 minutes parallel |
| Duplicate detection rate | 10-22% | 100% |
| Inflation detection | Random sample only | 100% of walls scored |
| Per-contractor accuracy tracking | Monthly | Real-time |
| 30/90-day durability check | Manual flyby | Random sample + AI scoring |
| Audit-grade retention | Manual collation | 7-year structured retention |
| BRSR Core readiness | Manual exercise | API-ready, on-demand |
| Dispute resolution time | 14-30 days | 2-5 days |
| Year-1 ROI | Baseline | 4-9x |
A 50,000 sq ft wall painting campaign is not 500 photos. It is 50,000 individually accountable square feet, each of which either exists on a wall somewhere in India or does not. The brand's job is not to look at more photos. The brand's job is to convert each square foot into an auditable line item. That is the only verifiable definition of "campaign completed."
Per-wall unique ID (WP-NNN) for every campaign asset
Pre-mapped GPS coordinates locked during scouting
Owner consent form + OTP for every wall
Reference object (A4 marker, printed scale) in every wall photo
AI photogrammetry for area measurement on every wall
Live-capture validation on every image
9-layer mock-location detection on every GPS
SHA-256 + perceptual hash on every image
Cross-village + cross-campaign duplicate detection
Painter face-match against pre-locked roster
Per-vendor area-inflation index refreshed weekly
5-10% physical tape audit stratified by district and contractor
30-day and 90-day degradation audit
Live coverage dashboard showing both wall count and verified area
Verified Execution Rate (VER) + Verified Area Rate (VAR) as contractual KPIs
Proof-before-payment workflow on verified area only
7-year audit-grade retention + BRSR Core-ready evidence pack
Verified by gOGig certification or equivalent independent verification standard
gOGig's AI photogrammetry + per-wall area accountability model works across all square-foot-billed outdoor and wall painting formats.
gOGig's AI photogrammetry and per-wall area verification pipeline is live across 18 Indian states for large-area wall painting campaigns.
Get every square foot independently verified before invoice approval
Free 14-day Field Execution Intelligence pilot for FMCG, cement, paint, agri-input, and BFSI marketing operations. Per-wall asset IDs, AI photogrammetry for area measurement, 9-layer mock-location detection, AI duplicate detection, live coverage dashboard, 30/90-day degradation audit, proof-before-payment on verified area. 100% verification accuracy. 100% fraud detection rate.
100%
AI accuracy
100%
Detection rate
4-9x
Year-1 ROI
Written by
gOGig Editorial Team
The gOGig Editorial team publishes research, frameworks, and field intelligence drawn from gOGig Labs' dataset of 10,000+ verified field submissions across FMCG, OOH, BTL, pharma, and BFSI sectors.
Was this article helpful?
Your feedback helps us write better content.

