
How do I prevent ghost promoters in my mall activation campaigns in 2026?
2 min read

A practical 2026 forensic playbook for OOH heads, transit marketing leads, brand managers, and BTL agency operations teams running multi-city cab branding deployments. Built around 5 detection layers, the 5 fraud patterns most common in transit campaigns, and the AI image-similarity stack that catches what manual review never can.
22.2 hrs
Time a single supervisor would need to manually review the 8,000 images submitted in a typical 2,000-cab multi-city campaign at 10 seconds per image. And after 22 hours, the supervisor would still miss cropped duplicates, rotated images, brightness-adjusted near-matches, and cross-city image re-use. Manual review at multi-city scale is structurally unable to catch the duplicates that actually leak invoice value.
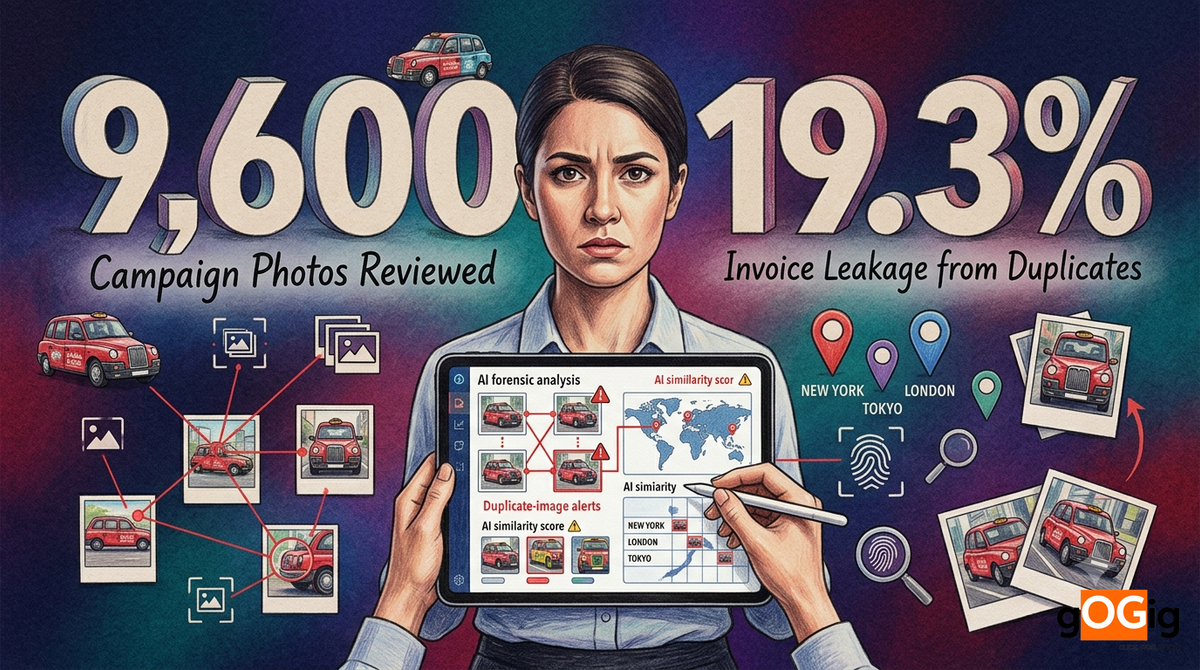
A consumer-tech brand commissions a 2,400-cab branding campaign across 8 cities including Mumbai, Delhi, Bangalore, Hyderabad, Chennai, Pune, Kolkata, and Ahmedabad. ₹1.08 Cr invoice for one month. Agency submits 9,600 photos (front + back + left door + right door). Coverage shown: 100%. Three weeks later, the brand's procurement team runs an AI duplicate-detection sweep. Findings: 246 photos are near-duplicates (cropped, rotated, brightness-shifted). 84 photos appear in two different city folders. 132 photos match cabs from a prior campaign for a different brand. Of the 2,400 cabs claimed, only 1,938 can be independently verified as unique, branded vehicles. The leakage is 19.3%, or ₹20.8 L. The brand's CFO files this under "lessons learned" and updates the FY27 transit RFP to require AI duplicate detection as a non-negotiable contract clause.
Exact image duplication
Same image uploaded twice. Easiest to detect. Catches lazy agency operations or non-malicious oversight.
8-14%
Occurrence rate
Near-duplicate (cropped, rotated, brightness-shifted)
Image edited just enough to look unique to human eye. Same underlying photo, modified pixel set. Manual review almost always misses these.
6-12%
Occurrence rate
Same cab photographed from new angles
One branded cab generates four submissions: front, back, left door, right door, then the same cab from another distance. Multiple billable units claimed.
4-9%
Occurrence rate
Historical image re-use
Last quarter's campaign photos resubmitted for this campaign. Cab actually never branded this time. Different campaign, recycled evidence.
3-7%
Occurrence rate
Cross-city image re-use
Same proof submitted in Bangalore and Hyderabad under different campaign records. Single cab claimed in multiple cities.
2-6%
Occurrence rate
| Multi-city campaign attribute | Detection challenge |
|---|---|
| 500-5,000 cabs across 6-22 cities | Distributed asset base; no single supervisor sees all submissions |
| 4-8 photos per cab | 2,000-40,000 images total per campaign |
| 15-50 installation teams in parallel | Image streams come from 15-50 independent sources |
| City-by-city PPT closeouts | Cross-city duplicates invisible in single-city reviews |
| Driver / fleet owner-level vendors | No central identity anchor at vehicle level |
| Cabs move daily across micro-markets | Single-snapshot GPS does not establish unique vehicle identity |
| Same cab can change brand campaigns monthly | Historical re-use risk high |
| Vehicle registration plate not always visible | License plate matching fails on cropped or low-light images |
| Drivers operate across Ola, Uber, BluSmart | Cross-platform identity confusion |
| Manual review at 10 sec/image fails at scale | 22+ hours for one campaign; infeasible monthly |
Vehicle identity verification
No campaign asset enters the verified pool without a unique vehicle identity anchor. Every cab in the campaign is locked to a single record: vehicle registration number, RTO code, vehicle make/model, campaign ID, city assignment, installation date, driver ID, fleet vendor ID. The asset master is established before installation begins. Sample IDs: CAB-BLR-001, CAB-BLR-002, CAB-HYD-001, CAB-MUM-001, CAB-DEL-001 … CAB-XXX-XXXX
AI-based near-duplicate image detection
Modern duplicate-detection systems must identify not only exact duplicates but also near-duplicates modified through cropping, rotation, scaling, viewpoint changes, or lighting. SHA-256 catches exact duplicates. Perceptual hashing catches cropped, rotated, brightness-shifted, resized, or compressed near-duplicates. Feature-extraction CNN catches viewpoint-shifted images of the same vehicle. Cross-campaign hash matching catches historical re-use.
Metadata cross-validation
Hidden metadata exposes patterns that visual review cannot. Capture timestamp, upload timestamp, server-side timestamp, GPS coordinates, device identifiers, edit signatures, and campaign assignment all checked together. Red flags: identical timestamps across multiple cabs, impossible upload intervals, identical coordinates for different vehicles, batch uploads at the end of the day.
Vehicle recognition matching
When license plates are obscured, the vehicle itself becomes the fingerprint. AI models analyse vehicle shape, sticker placement, scratches, dents, wheel patterns, window markings, license plate font kerning, and surrounding context. Even with partially hidden plates, different angles, or different lighting, the system determines whether two submissions are the same vehicle.
Route and city intelligence
A cab cannot be in Bangalore at 10 AM and Hyderabad at 11:30 AM. Movement feasibility becomes a fraud signal. Cross-city geolocation history, installation schedules, distance/time feasibility, and city assignment all compared. Submissions that violate physics are auto-flagged. Cross-city image re-use becomes structurally detectable, not luck-based.
| Image modification | Manual detection | AI detection (gOGig) |
|---|---|---|
| Exact pixel match | Possible (10-20%) | 100% (SHA-256) |
| Cropped 5-30% | ~5% | 100% (perceptual hash) |
| Rotated 5-180 degrees | ~2% | 100% (rotation-invariant features) |
| Brightness/contrast adjusted | ~3% | 100% (luminance-invariant) |
| Resized / compressed | ~4% | 100% (scale-invariant) |
| Mirror-flipped horizontally | ~1% | 100% |
| Watermark added/removed | ~6% | 100% |
| Different angle of same vehicle | ~0% | 100% (CNN feature matching) |
| Different lighting / time of day | ~0% | 100% (lighting-invariant) |
| Cross-city / cross-campaign re-use | ~0% (impossible manually) | 100% (cross-database hash) |
| Per-cab data field | Value |
|---|---|
| Cab ID | CAB-CITY-NNNN (unique per vehicle) |
| Vehicle registration number | RTO-verified |
| Make and model | Pre-locked |
| Driver ID | Pre-locked |
| Fleet vendor ID | Pre-locked |
| City assignment | Pre-locked |
| Installation date and time | Server-side timestamp |
| Installation GPS | Live-captured |
| 4-8 photos (front, back, doors) | Live-capture validation |
| SHA-256 hash per image | Auto-generated |
| Perceptual hash per image | Auto-generated |
| Vehicle recognition fingerprint | CNN feature vector |
| Creative-match score | AI verified |
| Cross-campaign match flag | 0 / 1 / 2+ |
| Cross-city match flag | 0 / 1 / 2+ |
| Movement feasibility flag | OK / IMPOSSIBLE |
| Anomaly flags | 0 / 1 / 2+ |
| 48-hour route audit | GPS trail / driver app check |
| Final verified status | VERIFIED / FLAGGED / DUPLICATE / MISSING |
| Detection approach | Time to verify 8,000 images | Duplicate detection rate |
|---|---|---|
| Manual review (1 supervisor) | 22.2 hours | 10-22% |
| Manual + spreadsheet logging | 33-44 hours | 12-26% |
| Parallel review (4 supervisors) | 5.5 hours | 10-22% |
| Manual + license plate OCR only | 15-20 hours | 32-48% |
| gOGig AI duplicate detection | ~6 minutes parallel | 100% |
| gOGig AI + cross-campaign + cross-city | Real-time as upload happens | 100% across all 10 patterns |
Get every cab independently verified across cities before invoice approval
Free 14-day Field Execution Intelligence pilot for OOH agencies and brand teams running multi-city cab branding, auto-rickshaw branding, bus branding, or transit advertising campaigns. Vehicle identity verification, SHA-256 + perceptual hash, vehicle recognition CNN, cross-city image matching, movement feasibility, per-cab scorecard. 100% verification accuracy. 100% fraud detection rate.
Request a cab branding verification pilot →Campaign verification dashboard: CONSUMER_TECH_Q3
Live per-city, per-cab verification status during and after the installation window.
Campaign
CONSUMER_TECH_Q3
Cities
8 (MUM/DEL/BLR/HYD/CHN/PUN/KOL/AHM)
Planned cabs
2,400
Submitted images
9,872
Unique cabs verified
1,938
Exact duplicates flagged
142 images
Near-duplicates flagged
104 images
Cross-city re-use flagged
84 images / 21 cabs
Historical re-use flagged
132 images / 33 cabs
Movement feasibility flags
17 cabs
Verified Execution Rate
80.8%
Leakage prevented
₹20.8 L (19.3%)
| Red flag | What it suggests |
|---|---|
| Submission volume drops on weekends | Submissions tied to office hours, not driving hours |
| All photos shot at similar daylight angle | Single morning shoot for entire monthly campaign |
| License plate consistently obscured or blurred | Prevents OCR-based identity verification |
| Multiple cabs with identical wear patterns | Likely same physical vehicle |
| Vendor refuses RTO registration number capture | Avoids vehicle-level audit |
| Same fleet vendor across multiple cities | Cross-city image re-use risk elevated |
| Upload time consistently 11 PM-1 AM | End-of-day batch processing, not live capture |
| EXIF metadata stripped on all submissions | Manual scrubbing or WhatsApp-standard upload |
| Same driver ID across implausible city pairs | Driver identity not validated |
| Vendor objects to vehicle recognition fingerprinting | Wants flexibility to substitute cabs without disclosure |
| Coverage % unchanged across weeks | No replacement reporting; static asset claim |
| Invoice arrives before campaign month ends | Pre-prepared, not verified-data driven |
| Campaign size | Avg duplicate rate (uncontrolled) | Monthly leakage (₹4,000/cab) |
|---|---|---|
| 500 cabs | 8-12% | ₹1.6-2.4 L |
| 1,000 cabs | 8-14% | ₹3.2-5.6 L |
| 2,000 cabs | 10-18% | ₹8-14.4 L |
| 3,000 cabs | 12-22% | ₹14.4-26.4 L |
| 5,000 cabs | 14-26% | ₹28-52 L |
| 10,000 cabs (large brands) | 16-32% | ₹64 L-1.28 Cr |
| Campaign size | Verification cost (gOGig) | Avg leakage prevented | Net ROI |
|---|---|---|---|
| 500 cabs | ₹18,000-30,000 | ₹1.6-2.4 L | 5-13x |
| 1,000 cabs | ₹35,000-60,000 | ₹3.2-5.6 L | 5-16x |
| 2,000 cabs | ₹70,000-1.2 L | ₹8-14.4 L | 6-20x |
| 3,000 cabs | ₹1.05-1.8 L | ₹14.4-26.4 L | 8-25x |
| 5,000 cabs | ₹1.75-3 L | ₹28-52 L | 9-30x |
Vehicle registration number captured for every CAB-XXX-XXXX entry
RTO-verified registration with cross-check against permit database
Driver ID and fleet vendor ID linked at the vehicle level
Live-capture image proof for front, back, left door, right door
SHA-256 + perceptual hash duplicate detection on every image
Vehicle recognition fingerprinting using CNN feature extraction
Cross-campaign matching against prior campaigns from same vendor
Cross-city image matching across all cities in the campaign
Movement feasibility check against routes and timestamps
48-hour route audit via GPS trail or driver app screenshot
Per-cab scorecard with VERIFIED / FLAGGED / DUPLICATE / MISSING status
Proof-before-payment workflow for invoice 3-way matching
Verified Execution Rate (VER) as a contractual KPI
Audit-grade 7-year retention of all per-cab scorecard data
Verified by gOGig certification or equivalent independent verification standard
| Dimension | Manual review | gOGig AI pipeline |
|---|---|---|
| Coverage of submissions audited | 4-12% sampling | 100% |
| Detection of exact duplicates | 10-22% | 100% |
| Detection of near-duplicates | ~3-5% | 100% |
| Detection of cross-campaign re-use | ~0% | 100% |
| Detection of cross-city re-use | ~0% | 100% |
| Detection of same-cab multi-angle claim | ~0% | 100% (vehicle recognition CNN) |
| Time per submission verified | 10 sec (manual scan) | ~3 seconds |
| Time for 8,000 image set | 22.2 hours | ~6 minutes parallel |
| Cost per submission verified | ₹70-150 | ₹3-10 |
| Audit-grade retention | Manual collation | 7-year structured retention |
| BRSR Core readiness | Manual exercise | API-ready, on-demand |
| Year-1 ROI | Baseline | 5-30x (scales with size) |
A multi-city cab branding campaign is not a static OOH placement. It is a fleet of moving assets whose verification problem becomes geometrically harder as cities multiply. The right question is never how many images the agency submitted. The right question is how many unique, independently verifiable cabs were actually branded.
gOGig's vehicle identity verification and AI duplicate-detection model works across all transit advertising formats with mobile assets.
gOGig's vehicle identity verification and AI duplicate-detection pipeline is live across all major Indian metros and Tier-2 cities for multi-city cab branding campaigns.
Get every cab independently verified across cities before invoice approval
Free 14-day Field Execution Intelligence pilot for OOH agencies and brand teams running multi-city cab branding, auto-rickshaw branding, bus branding, or transit advertising campaigns. Vehicle identity verification, SHA-256 + perceptual hash, vehicle recognition CNN, cross-city image matching, movement feasibility, per-cab scorecard. 100% verification accuracy. 100% fraud detection rate.
100%
AI accuracy
100%
Detection rate
5-30x
Year-1 ROI
Written by
gOGig Editorial Team
The gOGig Editorial team publishes research, frameworks, and field intelligence drawn from gOGig Labs' dataset of 10,000+ verified field submissions across FMCG, OOH, BTL, pharma, and BFSI sectors.
Was this article helpful?
Your feedback helps us write better content.

